Just two days ago, the Irish Independent ran a story saying that it was the warmest May on record:
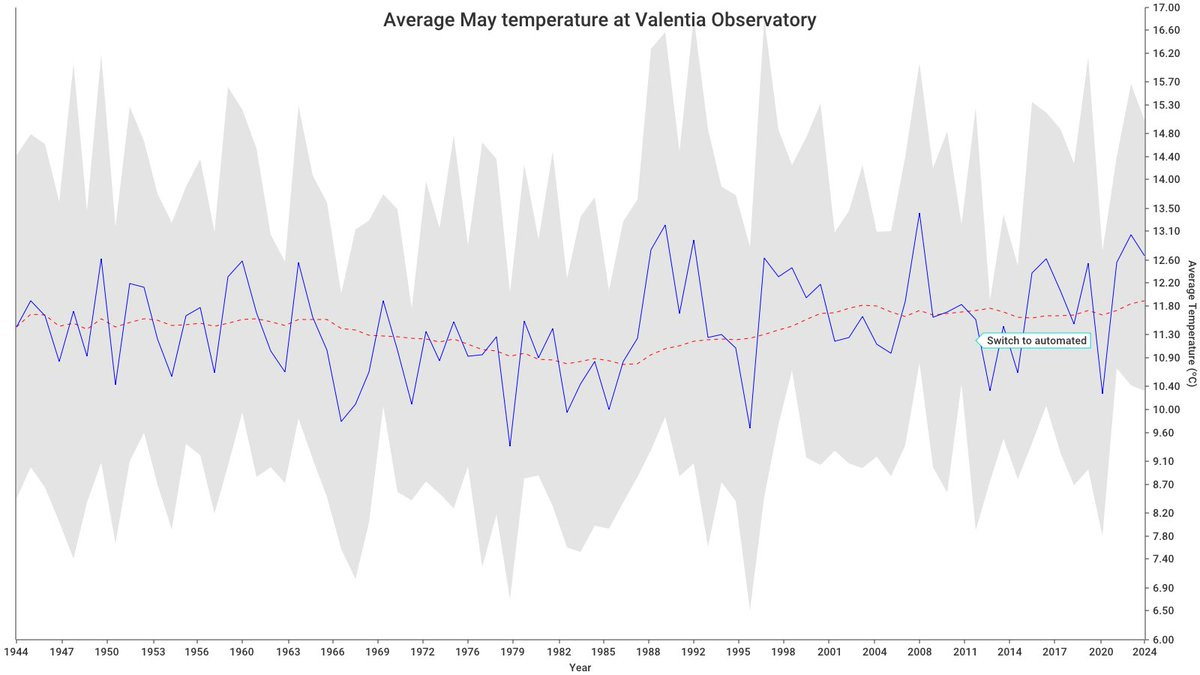
As of either today or yesterday, the hourly data for may was published, e.g. at https://data.gov.ie/dataset/valentia-observatory-hourly-data you can find our highest quality pure rural station with a stellar record... also known as Valentia Observatory in the Kingdom of Kerry. You can take that hourly data and average over the month of May all the way back to 1944... if you do that you'll get a graph that looks something like this:

The blue line is the average May temperature for each year. The grey area represents the 95% Confidence Interval from the daily average. In other words 95% of the days in May are between the upper and lower limits of the grey area. The dotted red line is a smoothed trend. It turns out that 2024's May average temperature of just slightly above 12.6°C (remember this is averaged over all 24h) was also observed in 2016, 1997, 1964, 1960 and 1949...
Slightly more annoying for people claiming things like:
The Irish meteorological service said overall, using the island of Ireland dataset, May 2024 was the warmest May on record with an average temperature of 13.08 degrees.
It would appear that 2023, 2008, 1992, 1989 and 1988 all had a higher average temperature at Valentia than 2024.
Before digging into that claim, we should maybe check the daily minimum and maximum temperatures at Valentia, available https://data.gov.ie/dataset/valentia-observatory-daily-data and also now including the data for May 2024...
First let's take a look at the average daily maximum temperature for May...

This is the same style of graph as before for the 24h average temperatures in the first graph. 1990 is the winner for Valentia with an average daily maximum of approx 17.1ºC compared with this year's 15.6ºC
Maybe we should look at the average daily minimum temperatures...

Here again, 2024 is not the winner with 2022, 2007 and 1997 just edging it out...
But Valentia has records going back to 1873... So what if we do not know the 24h average daily temperature from before 1944, we can compare the min and max temperatures...
So here's the average daily maximum temperature in Valentia going back to 1873

And the average daily minimum...

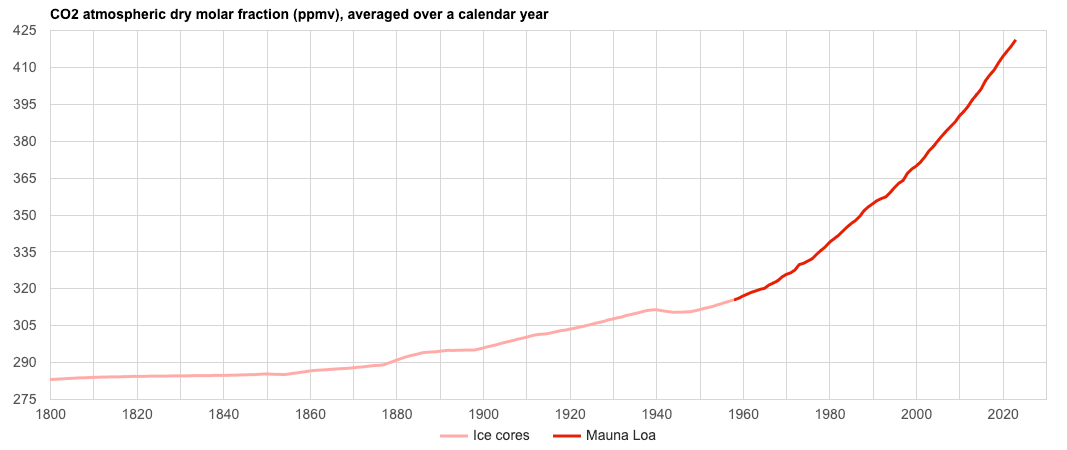
In 1873, the atmospheric carbon dioxide levels are estimated to have been approx 288ppm (from ice cores) and in 2023 the measured level at Mauna Loa was 421ppm. That is a 46% increase. And approximately half of that increase was since 1988.

Note: while correlation is not always causation, causation always produces correlation.
To be fair to Met Éireann, who really should be praised for their careful work recording the temperatures at Valentia, the article they quote is talking about an all Ireland average temperature. That means they are including the temperatures from places like Dublin Airport, which has gone from quite rural in the 1950's to a tad more built up with Ballymun and Finglas sneaking up from the south and Swords sneaking down from the north.
So maybe their averaging has swept up some of the urban heat island effect that south west Kerry has less influence from... but that would be a topic for a different day.
Depending on how you measure it, this May may or may not have been the warmest May on record, but I know that here in a leafy suburb of north Dublin in May 2020 it was warm enough to dine for breakfast in our north facing back garden about 5 or 6 times... and this May not even once... ultimately you can decide for yourself


Maybe the green leafy garden benefited from the CO2. Sounds lovely…no sign of impending doom,
In my part of Spain, northwest, this is probably the coldest June I can remember. Rained again today 🥰 I’m loving all the CO2, keeps everything green and ALIVE 🙏🏻